8 Steps for Troubleshooting Your Rust Build Times
- 1. Create a Speedy Build Experience
- 2. Throw Hardware At It
- 3. Big Things Build Slowly
- 5. Replace Your Linker
- 6. Crate Shattering
- 7. Conditionally Compile a “Go Fast” Feature
- 8. Use Small New Projects on the Side
To be able to troubleshoot Rust compilation, we first need to understand in a rough cut how it works. The goal is to give you a map that will be easy to remember, and be operational rather than highly detailed and academic.
Think of it as a kind of an 80/20 rule set for the first steps you should do when you are trying to handle a slow build that’s unacceptable. By the way, my focus here is on your development cycle and fast iteration, rather than a slow build in CI (but the tips here may be relevant for it as well).
A number of interesting steps in the Rust build cycle are:
- Take all crates and generate a DAG which is a convenient way to understand which crate depends on (or blocks the compilation of) another crate, and by that, for example — Rust will be able to understand which crates can run in parallel and use all machine cores
- If that’s not enough, divide each crate into codegen units to let LLVM process them in parallel as well
- And lastly, incremental compilation helps because Rust will save part of the compilation planning work from a previous build and reuse it in the next

LLVM serves as a major infrastructure for Rust. While Rust performs compilation tasks on its side, some of those tasks are handed off to LLVM and as such, become a black box to us, users of Rust.
Another important note is that LLVM is critical for speedy compilation, when it goes slow, Rust goes slow and that can happen as LLVM bakes in improvements and fixes. Rust being downstream to these changes, risks some of the changes as regression in compilation speed — sadly on the Rust side.
LLVM is also critical to your compilation speed because Rust is delegating a good part of the job of optimizing code to it. To get a feel — run a debug build and then a release build. You should see around an order of magnitude (10x) difference between the performance of the two builds.
We see static linking happening at the end of the build cycl e, which generates a nice and self-contained binary to use. While I find self-contained binaries extremely useful and am a big fan, it slows down each build (as opposed to dynamic linking when dependencies are loaded at runtime).
And now, for the steps.
1. Create a Speedy Build Experience
The first step to create a fast build is not to build at all. Using rust-analyzer in your editor and development process gives you just this experience. This means that you’re implicitly running cargo check which is the first tip for anyone trying to optimize their build speeds. Most people want fast feedback, and you can get that feedback with cargo check instead of cargo build.
2. Throw Hardware At It

With that first tip out of the way, the second tip is: before fixing a problem are you sure it really is a problem?. Which means in our world of slow builds, are you sure your Rust build being slow is really a problem? For example, if you can throw more hardware at it at a reasonable price, this “problem” goes away; you’re robbed of the experience of actually fixing it but the result is the same, the problem goes away. In Rust, more cores usually lead to faster builds, so make sure you have a good amount of cores in your CPU.
Rust has built in tools at your disposal that help you figure out what happens during the build process. We’re going to take a look at them, and order them by level of granularity and complexity (or investment) from your side.
Our goal is to find a simple tool that lets you discover a big problem, solve it quickly and get big wins. But we’re not always that lucky, so we’ll also explore other tools and techniques that may be useful, but also may lead to diminishing returns like with many optimization tools.
3. Big Things Build Slowly

The first sign of a big build process is a big binary and big things take more time to build right?. And eyeballing a binary size is something we can do without tools.
We already know that a big binary, with a reasonable or modest amount of our code means — lots of libraries that we probably use. We say probably because not always we understand the entire graph of dependencies that we use; most libraries take in other libraries as a dependency and so on.
This leads us to want to figure out which crates we use and what is their effect on our build in terms of size (which is a good indicator of build bottlenecks per our thesis earlier).
A great tool for that is cargo-bloat, which is inspired from the same intuition I've described here at Google (by the way: I've built such a tool for Go called goweight). cargo-bloat works with your cargo and any existing build:
$ cargo install cargo-bloat
Starting with a detailed view, and listing the top 10 results, gives us:
$ cargo bloat --release -n 10

While this is great for detailed analysis, what we want is the “big targets”, so let’s analyze by crates:
$ cargo bloat --release --crates
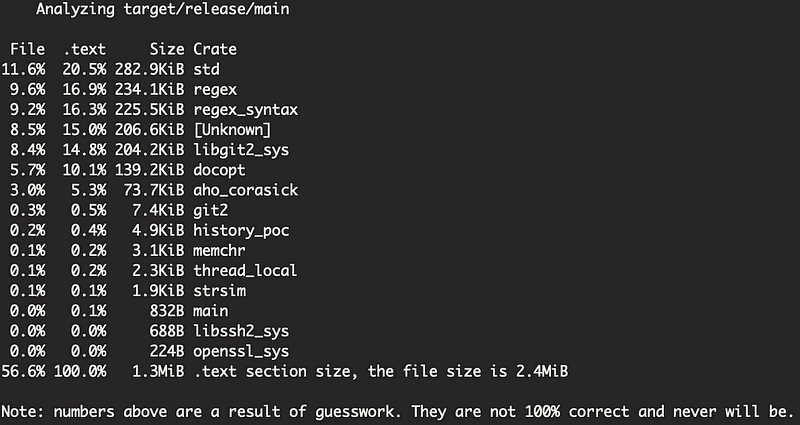
There we have it. According to our theory, regex, and libgit2 could be slowing our build because they result in taking a big chunk of our binary (and as a spoiler: this theory verifies later). At this stage, if you discover a big library that you use, and don't need, or can replace with something simpler -- you can do that and re-run the build. If you find that it shortens your build times and you're happy -- you incidentally found a build optimization unicorn -- with minimal effort invested and maximal gain. You've fixed the problem!### 4. Take a Deeper Look
In the case where we’re not so lucky, and unicorns don’t exist (sorry, unicorn fans!), we’re left with doing real build process analysis. We have a couple of ways to do that.
To get a view of how long everything takes in your build process, we use -Z time-passes:
$ RUSTFLAGS="-Z time-passes" cargo build
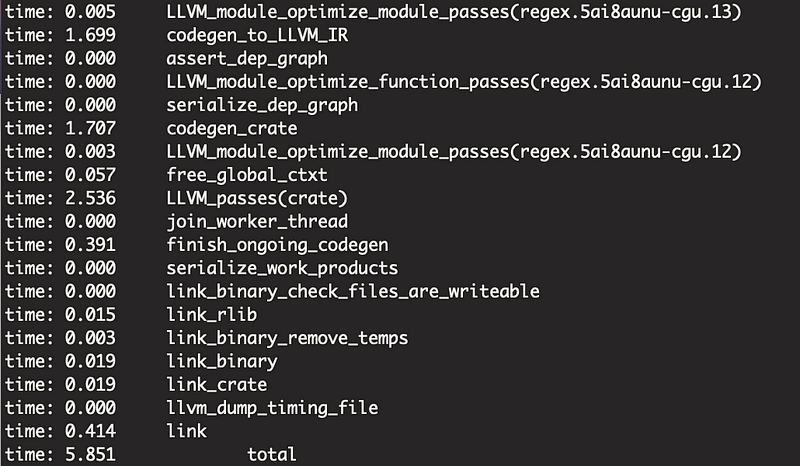
You’ll see a lot of data streaming fast. You get a detailed breakdown of the build process, per crate, and per compilation stage. By glancing at this you’ll be able to get an impression of the two most time consuming tasks: codegen and tasks that deal with LLVM handoff and optimization.
A magical view for your build
Actually, the best trade-off between high detail and high productivity, is a built in cargo flag, called timings. It's such a great tool, it's almost magical and in fact, I use it exclusively, even for smaller troubleshooting session.
If you run this:
$ cargo build -Z timings
You’ll get this:
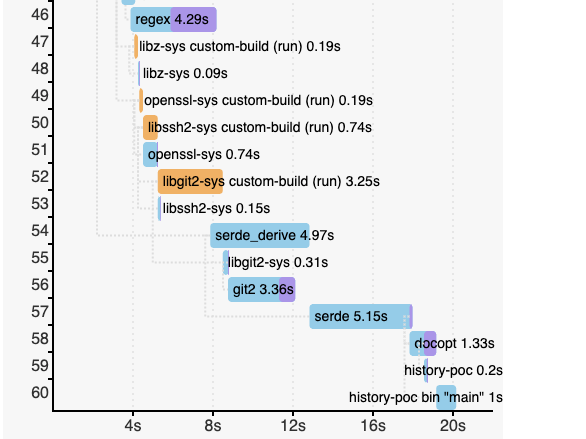
It is an interactive graph showing the build breakdown graph, where you can see times, parallelism, and deeply and effectively investigate why a build is slow. To me, being familiar with profilers in many other languages, it was mindblowing.
And then you get this which graphically shows you the bottlenecks, spikes and CPU usage as the build progresses:
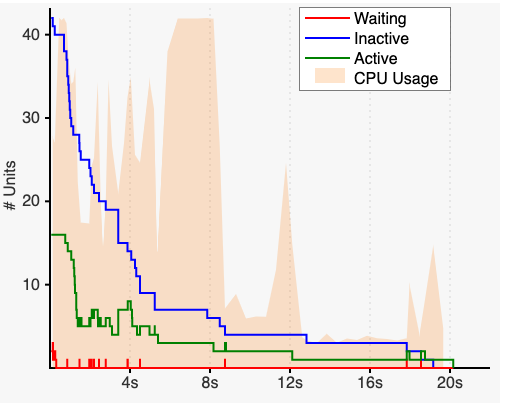
And here’s a larger, more complex build process:

You also get a nice breakdown that looks the same on a first glance, but on a second glance contains important information: the default features selected for every crate. This is actually your first experimentation opportunity. If you are not familiar with crate features — every crate you use can come with features that you can enable or disable, and then — it comes with the default set of features.
This means you can disable features you don’t need or use to get big compilation speed wins; in fact you should do this any way — keep a nice culture in your team of hand picking the features you use.

If it matters, keep in mind that cargo build -Z timings is unstable, to read more about it look here.
5. Replace Your Linker
While I don’t want to be too nostalgic (I’m tempted to), linking used to be a process you do by hand, or at least a process you’re very aware of, and used to be a common ceremony if you were doing assembler or C more than 20 years ago. Today it’s mostly transparent, or at least the experience of linking is.
A linker produces the final compilation output from various compiler object outputs. The kinds and types of compiler object output varies between compilers, languages and more.
We mostly have the linker produce a binary in a form of a dynamic library, or an executable.
In Rust, on some platforms (such as OSX) linking take a considerable amount of time from the general build process — too long. So this step is a good place to look for optimizations.
In addition, we have link-time optimization (LTO) which release build configuration uses to perform optimizations across code units, and is typically as expensive as it sounds.
What’s in a Faster Linker?
Why is replacing a linker faster? to get an impression, here’s the notes from zld 's README :
- Using Swiss Tables instead of STL for hash maps and sets
- Parallelizing in various places (the parsing of libraries, writing the output file, sorting, etc.)
- Optimizations around the hashing of strings (caching the hashes, using a better hash function, etc.)
Linux
In Linux the work is pretty much cut out for you by installing and using lld which is a much faster linker for Rust to use:
$ sudo apt-get install lld
Then, place a cargo config file in .cargo/config:
[target.x86_64-unknown-linux-gnu]
linker = "/usr/bin/clang"
rustflags = ["-Clink-arg=-fuse-ld=lld", "-Zshare-generics=y"]
Run your builds as usual and notice the improvement:
$ cargo build
macOS
This solution didn’t exist for a long while (you couldn’t do anything about linking speeds) for macOS, but recently we’ve got zld support and we can use it instead:
$ brew install michaeleisel/zld/zld
And now you can drop this in your cargo config file in .cargo/config:
[target.x86_64-apple-darwin]
rustflags = ["-C", "link-arg=-fuse-ld=/usr/local/bin/zld", "-Zshare-generics=y"]
This alone has cut my build times in half. HALF!
Run your builds as usual and notice the improvement:
$ cargo build
Global Or Local Config?
I recommend setting your ~/.cargo/config globally to enjoy faster build time around your workstation, however if you're uneasy about replacing a linker for what ever reason you can always have it local in every project's .cargo folder.
Either way, make sure production builds are made and cut only from your CI system, which doesn’t have any of these tweaks (just to be safe).
6. Crate Shattering

When you’re out of low-hanging fruit, you’re left with old fashioned grunt work. This means taking a long look at how your project is architecture and try to guess how to break or merge it in different ways.
One of the techniques in the Rust world is fondly named crate shattering which is the art of taking a project and breaking it up into crates using the workspace feature of Cargo, or taking an existing crate and breaking it apart to smaller ones. All this, in an attempt to play into Rust’s way of parallelizing builts.
Why art? because sometimes crate shattering causes the invest effect — challenging inlining and creating duplicate work for the Rust compiler (such as generic translation which is done per-crate); all this without a chance of a reasonable human effort of understanding the build intricacies and compensating for those.
We can’t stand a chance of imagining all of the compiler complexities and optimizations and figure out “oh, that file has to live in this crate then”.
There’s a pretty old reddit thread putting some data behind crate shattering, but I say this — try to design your project with multiple crates in mind for the sake of software engineering, and hope for the best. This way: there are already wins that you’ll gain in productivity by designing a great architecture for your project, and there’s a chance of wins in compile times.
7. Conditionally Compile a “Go Fast” Feature
Here’s a trick I’ve developed on my own, and I have indications in the Rust documentation for it but haven’t really seen it in the wild.
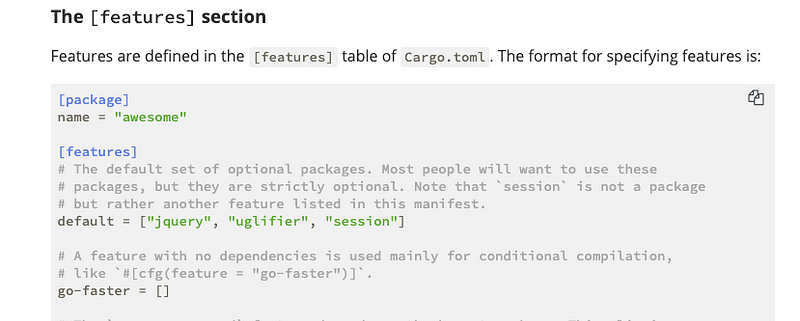
It goes like this; if you’re confident that there is some codebase in development time that you don’t really need, for example some kind of complex encryption algorithms — make that codebase a feature in the sense that it’s a special “go fast” feature — or any other name that you like, that when you activate this feature will conditionally compile it, and will leave it out of the build and therefore out of your compile times.
I’ve spotted it in the Rust docs, but still I’m not sure they meant what I mean, it’s called go-faster in this shot:
8. Use Small New Projects on the Side
When all fails, what works best is to just iterate quickly on an idea, a POC or a crate in a fresh folder, with this great feeling of starting from scratch: naturally a small amount of dependencies, small amount of source files, and low complexity for the compiler as a result.
When you’re done iterating fast, you can migrate this code into the monster of a project you’ve been suffering slow build times in.
This works so well, and is so refreshing, both in code-completion, code checks and compilation speeds that I build new features this way exclusively when I can.If you like developer tools, productivity and security — we’re looking for a great chat, and/or great people to join us at Spectral! drop us a line: hello@spectralops.ioImage credits:
- “Broken bridge” by Eva the Weaver is licensed with CC BY-NC-SA 2.0. To view a copy of this license, visit https://creativecommons.org/licenses/by-nc-sa/2.0/
- “The big truck at Sparwood 2010” by Gord McKenna is licensed with CC BY-NC-ND 2.0. To view a copy of this license, visit https://creativecommons.org/licenses/by-nc-nd/2.0/
- “Discarded Boxes” by cbmd is licensed with CC BY-NC-ND 2.0. To view a copy of this license, visit https://creativecommons.org/licenses/by-nc-nd/2.0/